
At Airplane, we collect observability data from our own systems as well as remote “agents” that are running in our customers’ infrastructure. The associated outputs, which include the standard “three pillars of observability” (logs, metrics, and traces) are essential for us to monitor our infrastructure and also help customers debug problems in theirs.
Over the last year, we’ve made a concerted effort to migrate most of our observability data generation and collection to the OpenTelemetry (OTel) standard. This has allowed us to collect data more reliably from more places, connect more easily with different vendors, and better monitor and control our costs.
In the remainder of this post, we explain what OpenTelemetry is, how we managed the migration, and lessons we learned along the way.
Aside: What is OTel?
OpenTelemetry (or OTel for short) is a set of standards and tools for processing observability data. It starts by defining the basic concepts (e.g., what a metric is) and the protocols for transmitting observability data from one system to another. It then provides a set of SDK libraries that allow for the instrumentation of applications in various programming languages (Python, Java, Golang, etc.) and the pushing of data via the former protocols. Finally, it provides a collector, a centralized component that receives data from various sources, applies arbitrary transformations to it, and exports the data to one or more downstream destinations.
There are a few nice things about OTel that make it superior to legacy observability frameworks.
First, it’s vendor agnostic. In theory, you can instrument a system and export observability data without being concerned about whether it’s ultimately going to Datadog, Splunk, Dynatrace, or some other vendor. And, even better, you can switch between these vendors without rewriting your applications.
Second, it unifies the different types of observability data, so you don’t need separate libraries and implementations for logs, metrics, and traces.
And third, it has fairly solid library support for the most common programming languages and application frameworks.
Original architecture
Before describing our migration to OTel, it’s helpful to summarize what kinds of observability data Airplane has and how we were collecting it pre-migration.
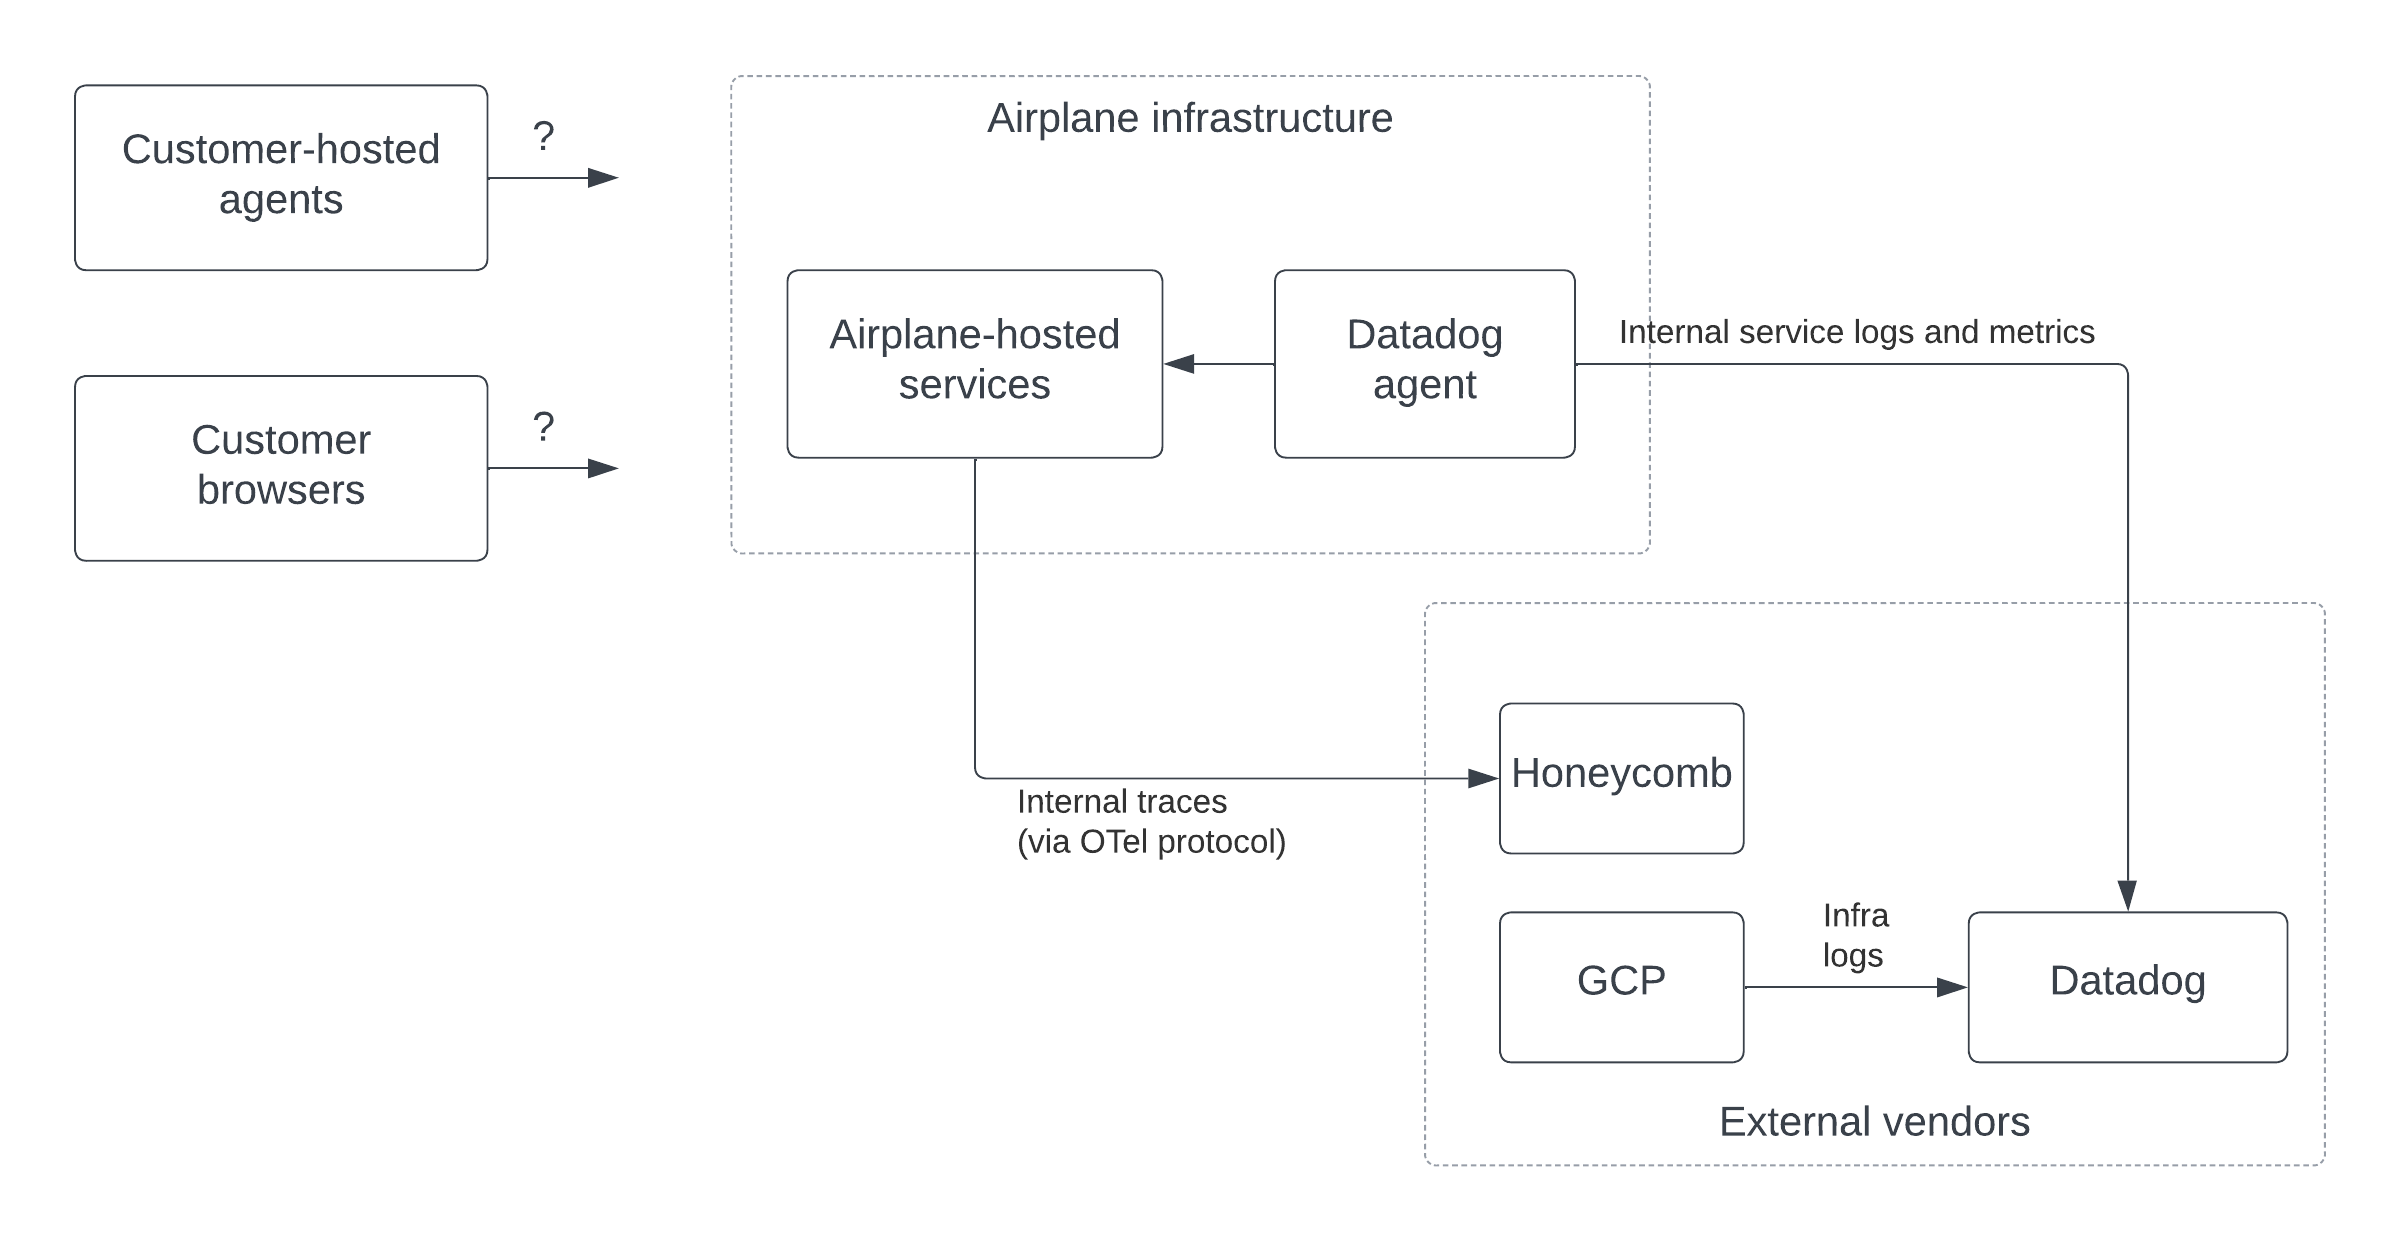
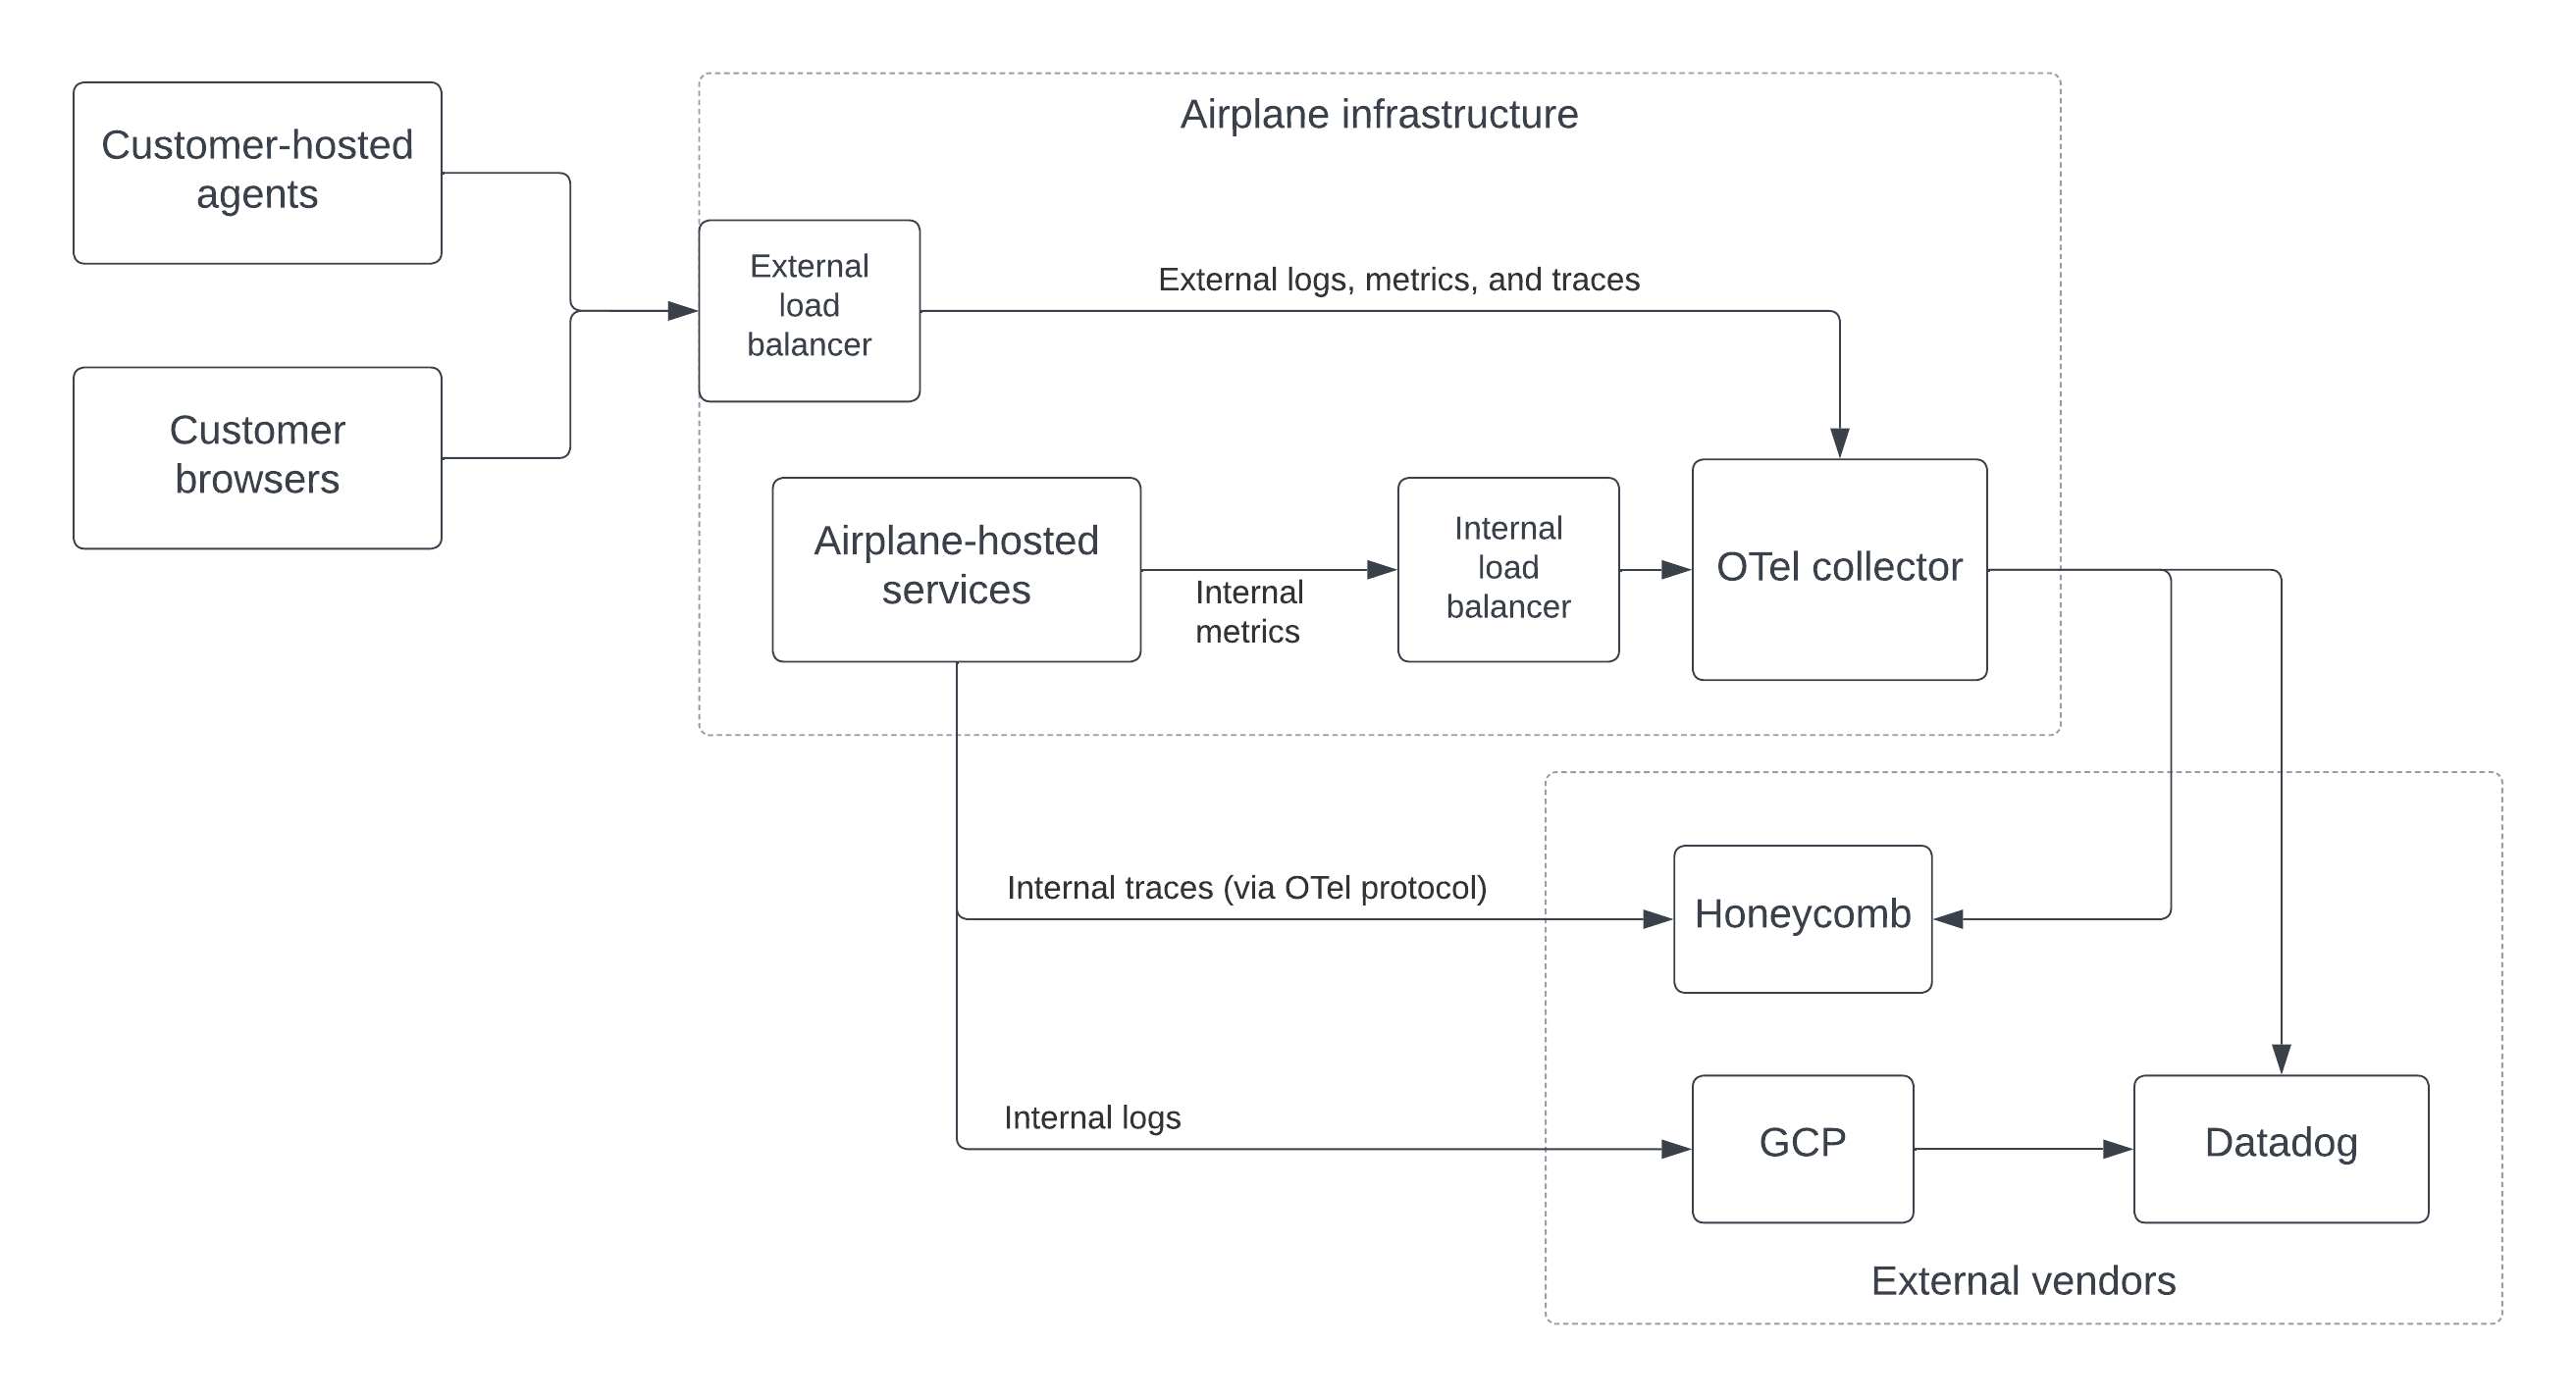
As mentioned in the introduction, Airplane has its own systems, plus “agents” that run in the infrastructure of our customers. We also have Airplane frontend code running in our customers’ browsers. Thus, there are effectively 9 different streams of observability data: {logs, metrics, traces} x {Airplane-hosted infra, customer-hosted infra, customer browsers}. The data collected from these streams is sent to several vendors including Datadog (for application logs and metrics), Honeycomb (for traces), and Google Cloud Logging (for infrastructure logs).
Originally, collection from customer-hosted infrastructure and browsers was minimal. When needed for debugging purposes, the state of these systems was pieced together via their calls to Airplane’s APIs (e.g., to poll for new task runs) plus information that customers supplied to us manually on request (e.g., screenshots of logs).
On the Airplane side, we relied heavily on the Datadog agent for both logs and metrics. The latter is a component that runs on each machine in an organization’s infrastructure, scraping logs and metrics for whatever is running on that machine and sending the data directly to Datadog’s collection APIs.
For metrics, the Datadog agent can either scrape metrics from each process using the Prometheus protocol or receive metrics that are pushed to it by each application using a protocol like Statsd. We originally decided to go with the former approach, and thus each of our applications exposed its metrics via an HTTP /metrics endpoint that was periodically read by the agent.
Trace data from Airplane-hosted infrastructure, on the other hand, was sent directly from our API to Honeycomb, our tracing vendor. We were already using OTel libraries for collecting and sending this data (Honeycomb’s API is fully OTel-compliant), so no significant migration was required here. However, we weren’t collecting traces from any systems other than our API, and we wanted to expand that.
Making the switch
Setting up the collector
The first step was to set up an OTel collector in each of our environments. As described previously, this is a component that receives observability data, processes it, and then exports it to vendor-specific collection endpoints for services like Datadog or Honeycomb.
The OTel collector was fairly easy to set up within our existing infrastructure- it’s a golang server that’s configured via a single YAML file. This config file specifies how data is received (e.g., via what protocols and on which ports), how the data should be transformed, and the downstream destinations that the data should be sent to.
The collector config documentation is generally well-written, but spread across a few places- the official OTel docs site, the collector GitHub repo, and the “contrib” GitHub repo, which is where most of the vendor-specific integrations are hosted.
After some trial-and-error, we managed to create a config for collecting logs, metrics, and traces, and sending them to Datadog and Honeycomb. The following shows a simplified version with some annotation comments:
Note that the collector has many other features that we decided not to use, particularly around data aggregation and filtering. We may enable these in the future, however, to reduce the data volumes that we send to our vendors downstream.
Once our collector service was up, we put internal and external load balancers in front of it so that both internal services and external agents could send it data.
Instrumentation
The next step was to instrument our applications to gather and send useful data to the collector. This was done in a set of small, independent projects, including:
- Exporting traces from our UI to the collector
- Exporting observability data from customer-hosted agents to the collector
- Switching metrics in Airplane-hosted systems from Prometheus+Datadog to OTel
Our frontend code is written in TypeScript and our backend systems use golang, so this involved integrating the OTel JavaScript and Go SDKs, respectively. The language-specific instrumentation guides in the OTel docs were very helpful here.
Switching our internal metrics was the most involved project because it required refactoring the pipelines that provide data for our (heavily used) internal dashboards and alerts. Moreover, we encountered some rough edges in the metrics-related functionality of the Go SDK referenced above. Ultimately, we had to write a conversion layer on top of the OTel metrics API that allowed for simple, Prometheus-like counters, gauges, and histograms.
In the end, we decided to not send certain flows through the collector. In the case of logs from our internal systems, we found that it was easiest to use our cloud provider, Google Cloud Platform (GCP), for collecting and distributing them. GCP’s log tooling is pretty powerful and easy to configure for applications in Google Kubernetes Engine (GKE), where we host most of our services. GCP is also the source for many of our non-application-based logs (e.g., DB errors), so we would be depending on this service whether or not we used it for application logs.
For internal traces, we decided to keep sending these directly to Honeycomb since Honeycomb already uses the OTel protocol (OTLP) and going through a collector wouldn’t add much value here.
Parting thoughts
Overall, we’ve been very happy with our new, OTel-oriented observability stack.
First, the SDKs and collector have been rock solid- we’ve had no significant issues running these at scale in production. As mentioned previously, the Golang SDK does have some rough edges (and doesn’t support logs at all yet), but we were able to get around these without too much trouble by writing some custom code on top of the OTel-provided interfaces.
Second, having an OTel collector has made it much easier to collect and process observability data from systems outside of our infrastructure. These systems can push their data to our collector, and thus we don’t need to worry about writing our own clients and servers for these flows or deal with scraping third-party destinations.
Third, OTel has allowed us to save a significant amount of money on our Datadog bill! Because we now use a centralized collector instead of per-node Datadog agents, the number of hosts that Datadog sees is significantly reduced. At $15 / host / month, we’ve been able to shave thousands off of our monthly Datadog charges.
Fourth, OTel allows us to more easily switch vendors in the future. We stuck with Datadog and Honeycomb during the migration, but it’s nice to know that if we wanted to try out others in the future, we could make that switch fairly easily.
If your organization is processing a lot of observability data, it may be worth investigating OTel as a solution for increased control and flexibility. And if you’re an Airplane user, you can also natively stream audit logs from your Airplane tasks to your OTel collector using our log drains feature.